Power BI: Prozent Berechnen


Prozentberechnung meistern – Grundlagen, Anwendungen und Tipps
Präzise Prozentberechnungen sind das Rückgrat fundierter Datenanalysen und strategischer Entscheidungsfindungen. DAX (Data Analysis Expressions) spielt dabei eine zentrale Rolle. Insbesondere bei der Aufdeckung von Verhältnissen und Veränderungen in Datenmengen erweisen sich Prozentberechnungen als unverzichtbar. Sie ermöglichen es, die Performance von Geschäftssegmenten zu bewerten, Trends zu identifizieren und Vergleiche anzustellen. Dieser Leitfaden führt in die essenziellen Konzepte der Prozentberechnung mit DAX ein, zeigt ihre breite Anwendbarkeit auf und liefert wertvolle Tipps, um die typischen Stolpersteine zu umgehen. Ein Power BI Training bietet dabei eine ideale Gelegenheit, die Grundlagen der DAX-Berechnungen zu erlernen und praxisnah im eigenen Unternehmen für eine effektive Datenanalyse einzusetzen.
Grundlagen der Prozentberechnung in DAX
Die Prozentberechnung ist ein wesentlicher Bestandteil der Datenanalyse in Power BI, und DAX (Data Analysis Expressions) bietet hierfür leistungsstarke Funktionen. Um Prozentsätze in Power BI effektiv zu berechnen, ist ein solides Verständnis von DAX unerlässlich. DAX ist eine reichhaltige und flexible Formelsprache, die speziell für die Datenmanipulation und -analyse in Power BI, Power Pivot in Excel und SQL Server Analysis Services entwickelt wurde. Benutzer können damit maßgeschneiderte Berechnungen durchführen und tiefgreifende Einsichten aus ihren Daten gewinnen.
DAX basiert auf Excel-Formeln, geht aber weit darüber hinaus. Es ermöglicht komplexere und leistungsfähigere Berechnungen. Ein grundlegendes Konzept in DAX für die Prozentberechnung ist die Verwendung von Aggregationsfunktionen wie SUM(), um Gesamtwerte zu berechnen. Diese Funktionen sind das Rückgrat vieler DAX-Operationen, da sie es ermöglichen, Daten über mehrere Zeilen hinweg zu summieren oder zu aggregieren.
Ein Schlüsselaspekt bei der Prozentberechnung in DAX ist die Kombination verschiedener Funktionen. Zum Beispiel kann die Berechnung eines Prozentsatzes eines Gesamtwertes durch die Formel Prozent = DIVIDE(SUM(Tabelle[Spalte]), Gesamtsumme, 0) erfolgen. Hierbei ist DIVIDE eine DAX-Funktion, die für die Division verwendet wird. Sie ist sicherer als die direkte Division (z.B. A/B), da sie die Handhabung von Divisionen durch null ermöglicht. Die SUM(Tabelle[Spalte]) ist der Zähler der DIVIDE-Funktion. Dabei ist SUM eine Aggregationsfunktion, die die Summe aller Werte in der angegebenen Spalte berechnet. Tabelle[Spalte] bezieht sich auf spezifische Spalten in einer Tabelle, deren Wert summiert werden soll. Gesamtsumme ist der Nenner der DIVIDE-Funktion. Es soll eine Zahl oder ein Ausdruck sein, der eine Zahl ergibt, durch die die Summe geteilt wird. Dabei könnte es sich um eine feste Zahl, die Summe einer anderen Spalte, ein Measure oder ein anderer berechneter Wert sein. Zuletzt ist 0 der optionale dritte Parameter der Funktion. Er definiert den Wert, der zurückgegeben werden soll, falls der Nenner Null ist. In diesem Fall wird, wenn Gesamtsumme Null ist, statt eines Fehlers der Wert 0 zurückgegeben.
Ein weiterer wichtiger Aspekt in DAX ist das Verständnis des Kontexts, in dem Berechnungen stattfinden. DAX unterscheidet zwischen Zeilenkontext (siehe Blogartikel dazu) und Filterkontext. Der Zeilenkontext bezieht sich auf einzelne Zeilen in einer Tabelle, während der Filterkontext sich auf den Teil der Daten bezieht, der durch Filter auf der Ebene von Berichten, Visualisierungen oder einzelnen Berechnungen eingeschränkt ist. Dieses Konzept ist entscheidend, um korrekte Prozentberechnungen durchzuführen, insbesondere wenn man mit komplexen Datenmodellen arbeitet.
Anwendungsbeispiele: Marktanteile, Wachstumsraten und mehr
Prozentberechnungen in Power BI sind ein mächtiges Werkzeug, das in einer Vielzahl von Geschäftsszenarien Anwendung findet. Von der Berechnung von Marktanteilen bis hin zur Analyse von Wachstumsraten – diese Berechnungen sind ausschlaggebend für strategische Entscheidungen und das Verständnis von Geschäftsdynamiken.
Klassische Beispiele für die Anwendung von Prozentberechnungen in Power BI sind:
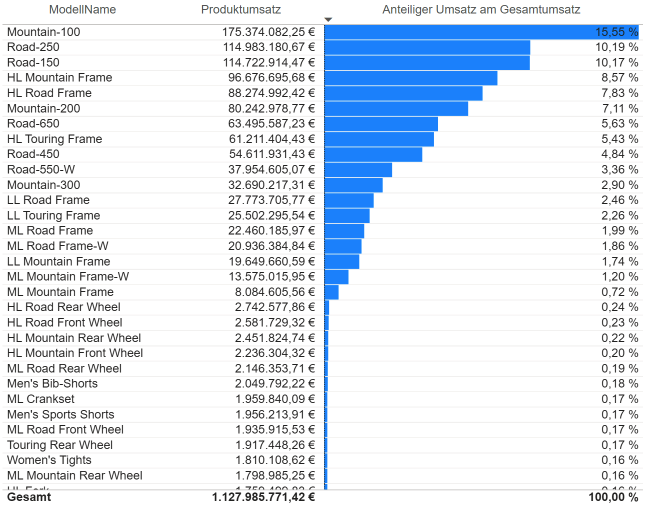
1. Ermittlung von Marktanteilen
Kontext: Marktanteile sind ein kritischer Indikator für die Wettbewerbsfähigkeit eines Unternehmens. Sie helfen dabei, die Stärke eines Produkts oder einer Dienstleistung im Vergleich zum gesamten Markt zu verstehen.
Anwendungsbeispiel: Angenommen, dein Unternehmen verkauft drei verschiedene Produkte. Um den Marktanteil eines dieser Produkte zu berechnen, würdest du den Umsatz dieses Produkts durch den Gesamtumsatz aller Produkte teilen. Diese Berechnung zeigt, wie viel Prozent des Gesamtmarktes das Produkt ausmacht.
Ziel: Bestimmung des Prozentsatzes des Gesamtmarktes, den ein bestimmtes Produkt oder eine Dienstleistung einnimmt.
DAX-Formel für Marktanteil:
Marktanteil = DIVIDE(SUM(Tabelle[Umsatz]), Calculate( SUM(Tabelle[Umsatz]), All(Produkttabelle)), 0)
Ausführliche Erklärung:
- SUM(Tabelle[Produktumsatz]): Diese Funktion summiert den Umsatz des spezifischen Produkts.
- Calculate( SUM(Tabelle[Umsatz]), All(Produkttabelle)): Hier wird der Gesamtumsatz durch die Verwendung der All-Funktion für alle Produkte summiert. Die All-Funktion bewirkt das der Umsatz unabhängig von äußeren Filtern aus der Produkttabelle berechnet wird.
- DIVIDE: Diese Funktion teilt den Produktumsatz durch den Gesamtumsatz. Der dritte Parameter 0 ist ein optionaler Parameter, der definiert, was zurückgegeben wird, falls der Nenner 0 ist, um Division-durch-Null-Fehler zu vermeiden.
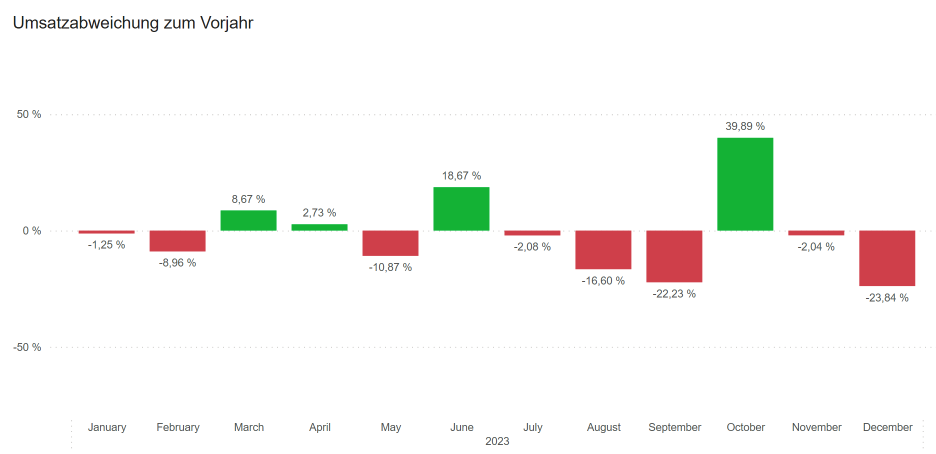
2. Berechnung von Wachstumsraten
Kontext: Wachstumsraten sind entscheidend, um die Dynamik eines Unternehmens zu verstehen. Sie zeigen auf, wie sich kritische Kennzahlen, wie Umsatz oder Kundenanzahl, im Laufe der Zeit verändern.
Anwendungsbeispiel: Um die jährliche Wachstumsrate des Umsatzes zu berechnen, vergleicht man den Umsatz dieses Jahres mit dem des Vorjahres. Die Formel zeigt die Veränderung als Prozentsatz, was hilft, die Umsatzentwicklung Jahr für Jahr zu analysieren und zu verstehen, ob das Unternehmen wächst, stagniert oder schrumpft.
Ziel: Analyse der Entwicklung von Geschäftskennzahlen über die Zeit, z.B. Umsatzwachstum.
DAX-Formel für Wachstumsrate:
Wachstumsrate = DIVIDE(SUM(Tabelle[Umsatz]), Calculate(SUM(Tabelle[Umsatz]), DATEADD(Datumstabelle[Datum], -1, Year)), 0)
Ausführliche Erklärung:
SUM(Tabelle[UmsatzDiesesJahr]): Summiert den Umsatz des aktuellen Jahres.Calculate(SUM(Tabelle[Umsatz]), DATEADD(Datumstabelle[Datum], -1, Year)): Summiert durch die Verwendung von derDateadd()-Funktion den Umsatz des vorherigen Jahres.DIVIDE: Teilt den Umsatz dieses Jahres durch den Umsatz des Vorjahres. Der dritte Parameter0verhindert Fehler durch Division durch Null.
Neben Marktanteilen und Wachstumsraten gibt es zahlreiche weitere Anwendungsmöglichkeiten für Prozentberechnungen, wie:
- Effizienzanalysen: Berechnung des Prozentsatzes der genutzten Ressourcen im Vergleich zu den verfügbaren Ressourcen.
DAX-Formel:Effizienzrate = DIVIDE(SUM(Tabelle[Genutzte Ressourcen]), SUM(Tabelle[Verfügbare Ressourcen]), 0) - Kundensegmentierung: Ermittlung des Anteils bestimmter Kundengruppen am Gesamtkundenstamm.
DAX-Formel:Kundensegmentanteil = DIVIDE(COUNTROWS(FILTER(Tabelle, Tabelle[Kundensegment] = "Stammkunden")), COUNTROWS(Tabelle), 0) - Budgetvergleiche: Vergleich der tatsächlichen Ausgaben mit dem Budget in Prozent.
DAX-Formel: :Budgetabweichung = DIVIDE(SUM(Tabelle[Tatsächliche Ausgaben]) - SUM(Tabelle[Budget]), SUM(Tabelle[Budget]), 0)
Die Fähigkeit, Prozentberechnungen in Power BI durchzuführen, eröffnet eine Welt der Möglichkeiten für datengesteuerte Einblicke und Entscheidungen. Von der Bewertung der Marktposition bis hin zur Messung des Unternehmenswachstums – diese Werkzeuge sind unverzichtbar für die moderne Geschäftsanalyse.
Tipps zur Formatierung und Darstellung von Prozentwerten in Power BI
Die korrekte Darstellung von Prozentwerten in Power BI ist entscheidend, um die Verständlichkeit und Professionalität von Berichten zu gewährleisten. Eine klare und präzise Präsentation von Prozentsätzen kann den Unterschied ausmachen, wenn es darum geht, Daten effektiv zu übermitteln, und fundierte Entscheidungen zu treffen.
Um Prozentwerte in Power BI effektiv darzustellen, ist es wichtig, das Prozentformat in den Visualisierungsoptionen zu nutzen. Dies beginnt mit der Auswahl des Datenfeldes, das als Prozentsatz formatiert werden soll, gefolgt von der Anpassung der Formatierungsoptionen, um 'Prozent' auszuwählen und die Dezimalstellen nach Bedarf festzulegen. Eine klare Darstellung erfordert oft eine Begrenzung der Dezimalstellen auf ein oder zwei für allgemeine Übersichten und eine Erhöhung für detaillierte Analysen. Visuelle Hilfsmittel wie Balken-, Säulen-, Kreis- oder Ringdiagramme sowie Karten mit Farbverläufen können die Dateninterpretation erleichtern. Es ist essenziell, den Kontext durch präzise Begleittexte und Beschriftungen zu unterstützen und um die Daten korrekt und ansprechend zu präsentieren. Diese Schritte tragen dazu bei, die Qualität und Effektivität von Power BI-Berichten zu steigern.
Fallstricke und häufige Fehler in der Prozentberechnung in Power BI vermeiden
Die Prozentberechnung in Power BI kann komplex sein, und es gibt einige häufige Fallstricke, die zu ungenauen oder irreführenden Ergebnissen führen können. Ein tiefes Verständnis der Funktionsweise von DAX und der Datenmodellierung in Power BI ist entscheidend, um diese Fehler zu vermeiden.
Einer der häufigsten Fehler in der Prozentberechnung in Power BI ist die Missachtung des Kontexts, in dem die Berechnung stattfindet. DAX-Formeln werden nicht isoliert ausgeführt; sie reagieren auf den Filter- und Zeilenkontext des aktuellen Berichts oder der aktuellen Visualisierung.
Beispiele und Lösungen:
- Filter und Slicers: Wenn du Filter oder Slicers in einem Bericht verwendest, ändern diese den Filterkontext, was die Ergebnisse deiner DAX-Berechnungen beeinflussen kann. Es ist wichtig, die Auswirkungen von Filtern auf deine Berechnungen zu verstehen und gegebenenfalls Funktionen wie ALL() oder CALCULATE() zu verwenden, um den gewünschten Kontext zu steuern.
- Zeilenkontext: In Pivot-Tabellen oder bestimmten Visualisierungen kann der Zeilenkontext das Ergebnis von Prozentberechnungen beeinflussen. Stell sicher, dass du verstehst, wie DAX-Formeln in verschiedenen Kontexten interpretiert werden.
Ein weiterer häufiger Fehler ist die falsche Behandlung oder Interpretation von Nullwerten in DAX-Formeln. Nullwerte können in Datenquellen aus verschiedenen Gründen auftreten und müssen sorgfältig behandelt werden, um genaue Berechnungen zu gewährleisten.
Tipps zur Handhabung von Nullwerten:
- Verwendung von
IF()oderCOALESCE():Diese Funktionen können helfen, Nullwerte zu identifizieren und durch einen Standardwert zu ersetzen, bevor eine Prozentberechnung durchgeführt wird. - Verständnis der Auswirkungen auf Aggregationsfunktionen: Wissen, wie Aggregationsfunktionen, wie
SUM(), Nullwerte behandeln, ist wichtig. In einigen Fällen können Nullwerte das Ergebnis einer Berechnung verzerren.
Verkomplizierung von Formeln:
Das Verkomplizieren von DAX-Formeln kann zu Fehlern und Verwirrung führen. Einfachheit und Klarheit in deiner Formeln kann helfen, Fehler zu vermeiden und die Wartung deiner Berichte zu erleichtern.
Lösungsansätze:
- Schrittweise Entwicklung: Baue deine Formeln schrittweise auf und teste jede Komponente einzeln.
- Kommentare und Dokumentation: Kommentiere deine Formeln und halte eine Dokumentation bereit, um die Nachvollziehbarkeit und Wartbarkeit zu verbessern.
Nichtbeachtung von Datenqualität und -struktur
Die Qualität und Struktur der zugrunde liegenden Daten sind entscheidend für genaue Prozentberechnungen. Unvollständige oder schlecht strukturierte Daten können zu irreführenden Ergebnissen führen.